
CASE 06
Home Energy Management System:
Visualising Energy Data for Smarter Living
Overview
Designed the energy monitoring and optimisation experience for the Konec smart home platform, spanning mobile app and wall-mounted control panel. Translated complex energy data — solar generation, grid consumption, battery storage, electricity pricing — into intuitive visual interfaces and AI-powered conversational insights for everyday homeowners.
Role: Product Design Lead — led end-to-end Energy & AI UX/UI
Timeline: Jun. 2025 to Feb. 2026
Platform: iOS, Android, Web, Control Panel
Skills: Data Visualisation, UX Strategy, System Design, AI Integration
Status: 🚀Launched (Integrated in Konec Home App & Home Center Screen)
tl;dr
Energy systems expose homeowners to complex, fragmented data across solar, grid, battery, consumption, and pricing. The challenge was to turn that technical infrastructure into a clear, trustworthy experience people could understand and act on across mobile and wall-mounted displays.
Launched in the Konec Home app and Home Center screen
Made live energy flow, saving opportunities, and system performance easier to understand
Established a scalable visual system now serving thousands of homes
Shifted energy management from technical monitoring to practical, sustainable daily decisions
Mapped 8 core energy-flow states with engineering
Designed a home-centred live dashboard and responsive cross-platform system
Structured 17 saving triggers into 2–3 contextual suggestions using saved plans and live energy data
Integrated Ted AI for plain-language questions, forecasts, and visual energy insights
Core Challenge:
What I did:
✦ Results & Impact:
01
Understanding System Logic & Strategic Positioning
Technical Layer: Defining the Energy States
Before designing the interface, I worked with engineering to map how solar, battery, grid and home load interact across changing conditions. We translated these rules into eight valid energy-flow states, plus an “unknown” fallback for incomplete or unreliable data.
This shared model became the foundation for the live energy visualisation, ensuring every UI state reflected actual system behaviour.
SYSTEM STATE INPUTS
solar-home
Solar directly powers the home load
solar-home-grid(buy)
Solar supplies the home; grid covers the shortfall
solar-home-grid(sell)
Solar supplies the home and exports the surplus
battery-home-grid
Battery powers the home with grid support
battery-home
Battery alone supplies the home load
grid-home
Grid alone supplies the home load
battery-grid
Battery exports stored energy to the grid
solar-battery
Solar surplus charges the home battery
unknown
Energy flow cannot be reliably identified
Strategic Layer: From System Metrics to Everyday Decisions
Competitive energy dashboards often prioritised system diagnostics, battery performance and financial metrics. Research with homeowners revealed a different need: they wanted to understand what was happening, why it mattered and what action to take next.
This shifted the product strategy from equipment optimisation to everyday energy decisions—when to run high-load appliances, how to use more available solar energy and where to reduce avoidable grid consumption.
The opportunity wasn’t to show more energy data—it was to help homeowners make better everyday decisions.
PRODUCT FOCUS
TYPICAL DASHBOARD
KONEC APPROACH
Goal
System optimisation & ROI
Comfort, savings & clarity
Action
Manual configuration
Contextual suggestions
Tone
Technical & operational
Helpful, transparent & proactive

Engineering model used to validate energy states
02
Energy System — Core Dashboard Design
A Home-Centred Mental Model
Rather than organising the dashboard around technical equipment, we placed the home at the centre of the live energy flow. Solar, battery and grid remain visible around it, allowing homeowners to understand at a glance where power is coming from, where it is going and whether the battery is charging or discharging.
Colour-coded connections and motion communicate active flow direction, while key power values remain available for users who want more detail. This reduces interpretation effort without hiding the underlying system.
Mobile — Live energy flow and cumulative performance
Home Center — Persistent monitoring and historical trends
01 Fixed positions
Sources stay in familiar locations.
02 Consistent colours
Each energy source keeps one colour.
03 Directional motion
Animation reveals the active flow.
One Visual Language, Multiple Energy States
Three representative examples from eight validated energy-flow states.
01 Solar Powers the Home
Solar directly supplies the household load.
02 Solar Surplus Export
Solar powers the home and exports excess energy to the grid.
03 Battery with Grid Support
The battery powers the home while the grid covers the remaining demand.
One Mental Model, Adapted by Context
The home-centred model remains consistent across devices. Mobile prioritises live status and key flows; the wall display adds persistent monitoring and trend analysis.
03
Energy-Saving Insights — Turning Energy Data into Action
Prioritising the Right Suggestions
We defined 17 energy-saving triggers and organised them into a modular recommendation framework.
After saving their usage plan, users can generate suggestions in the Advisor. The system combines the saved plan with live solar generation, battery status, forecasts and local time-of-use tariffs to surface only 2–3 timely, actionable suggestions.
CORE MODULE ARCHITECTURE
Energy-Saving Suggestions
Timely actions ranked by savings potential and household relevance.
Usage Planning
User-defined schedules capture household routines as an input for suggestion generation.
Forecasts & Tariffs
Solar forecasts and electricity pricing in one decision context.
Savings Summary
Clear feedback on solar value, self-consumption and cost savings.
Solar Surplus
HIGH IMPACT
Run high-power appliances while surplus solar is available
Increase solar self-consumption
Peak Rates Ahead
TIME-SENSITIVE
Pre-cool your home before peak pricing begins
Reduce grid use during peak-rate periods
Negative Electricity Price
PRICE OPPORTUNITY
Charge your EV or battery during negative-price windows
Take advantage of lower-cost grid energy
The planner keeps users in control — turning a complex energy curve into an appliance schedule shaped around their daily routines.
Users adjust their 24-hour appliance schedule, then save the plan to continue in the Advisor.
After saving, users return to generate suggestions and automate selected actions.
01 EDIT & SAVE THE USAGE PLAN
02 GENERATE ENERGY-SAVING SUGGESTIONS
Save and Returen

04
AI-Powered Energy-Saving Insights with Ted
Context-Aware Energy Conversations
Ted transforms complex household energy data into answers homeowners can understand and act on. Instead of interpreting technical dashboards or calculating energy ratios, users can ask questions in plain language—from current battery status to weekly consumption trends.
Each response combines a concise explanation with the most relevant visual format: live system summaries, historical charts, solar forecasts or performance cards. This makes the conversation more than a chatbot—it becomes a contextual layer connecting energy data to everyday decisions.
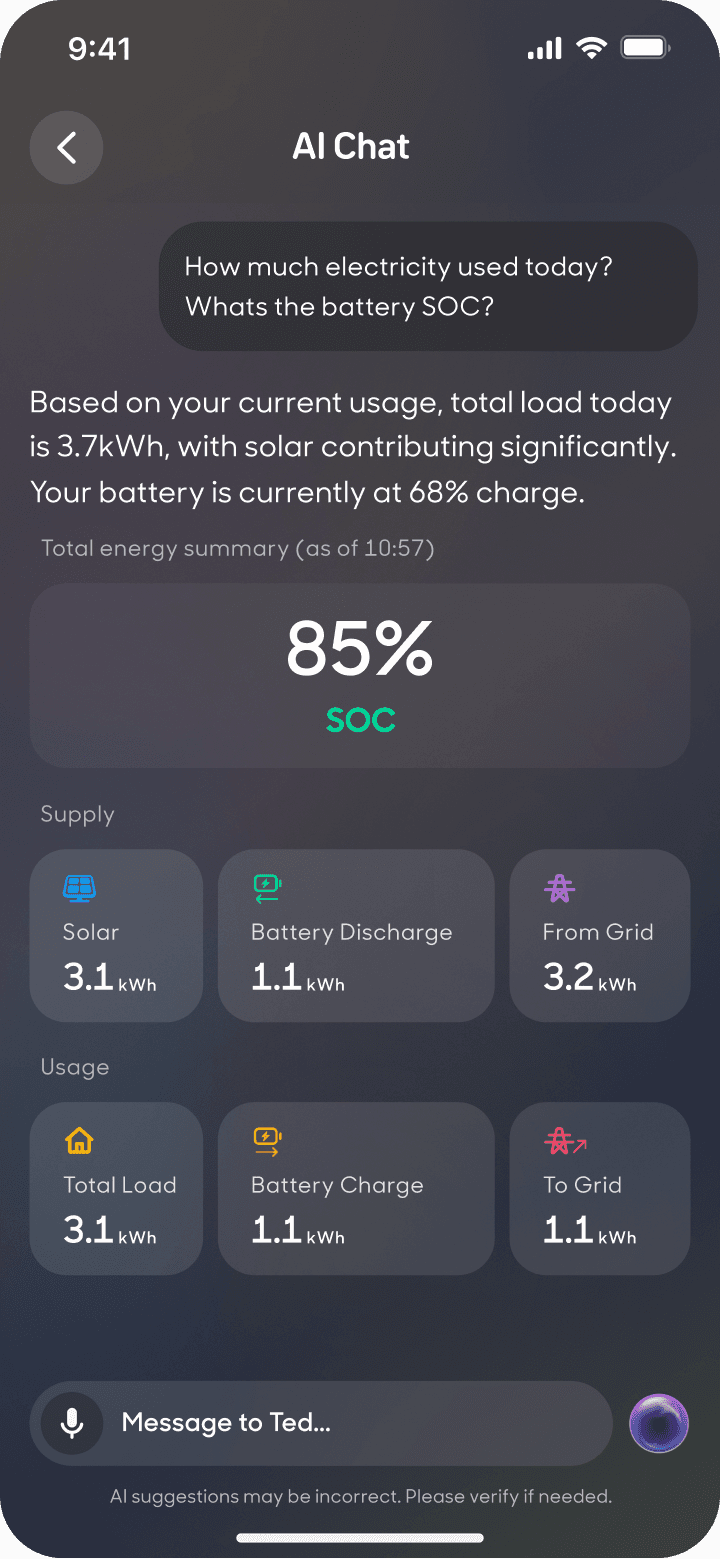


Four questions, four purpose-built visual responses
Depending on the question, Ted selects the clearest response format—from a live system snapshot to a trend chart, forecast timeline or performance breakdown.
01 — Live energy status
02 — Weekly usage comparison
03 — Solar forecast and appliance timing
04 — Self-consumption and grid dependence
The next phase will allow Ted to learn recurring household patterns—such as AC settings and EV charging schedules—to deliver more relevant recommendations while keeping every optimisation transparent and user-controlled.
Next Step: Personalised Learning
Reflection
Designing for home energy taught me that clarity does not come from simplifying the data—it comes from revealing the right relationship at the right moment.
The strongest outcomes came from treating engineering logic and everyday behaviour as one design problem. Mapping the energy states with engineering made the system accurate; centring the experience on the home, user-defined planning, contextual suggestions and visual responses from Ted made that accuracy understandable and actionable.
As AI capabilities evolve, transparency and user control will remain essential. The system launched across Konec Home and Home Center, and its modular visual language now provides a foundation for serving thousands of homes—and for evolving from energy monitoring towards confident, sustainable daily decisions.